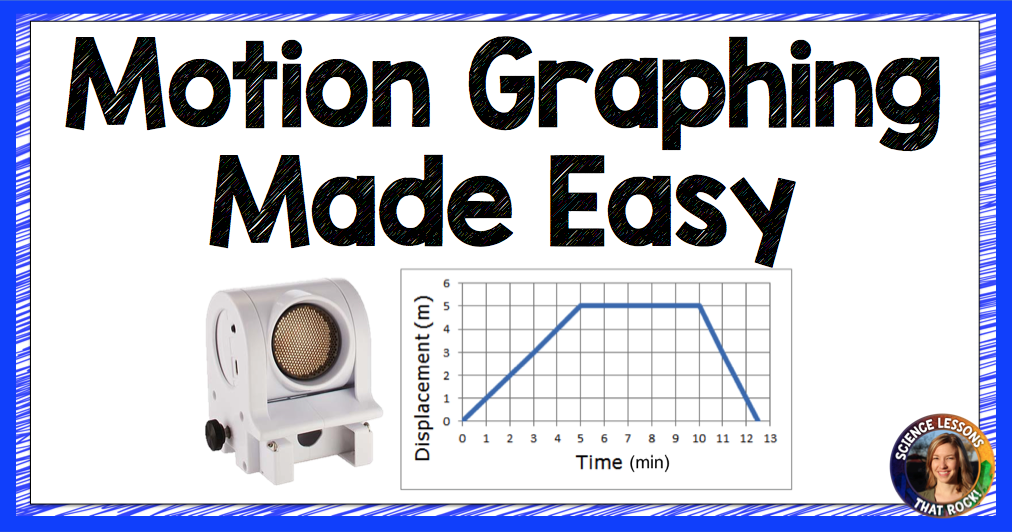
One product you can use for motion graphing is PASCO’s wireless motion sensor. This sensor works on bluetooth and is completely wireless, so students can move around the room without worrying about tripping over cords. If you have laptops you can even do your lab outside where you have more room to space out! Simply charge the motion sensor with a USB cord and it’s ready to go.
To use the motion sensor, you need to download PASCO’s free Match Graph software. (This was the only hiccup I had when using the motion sensor- if you are using school computers that require I.T. approval to download any software, you will have to put in a help desk ticket. Once it was installed by my tech department it worked like a breeze).
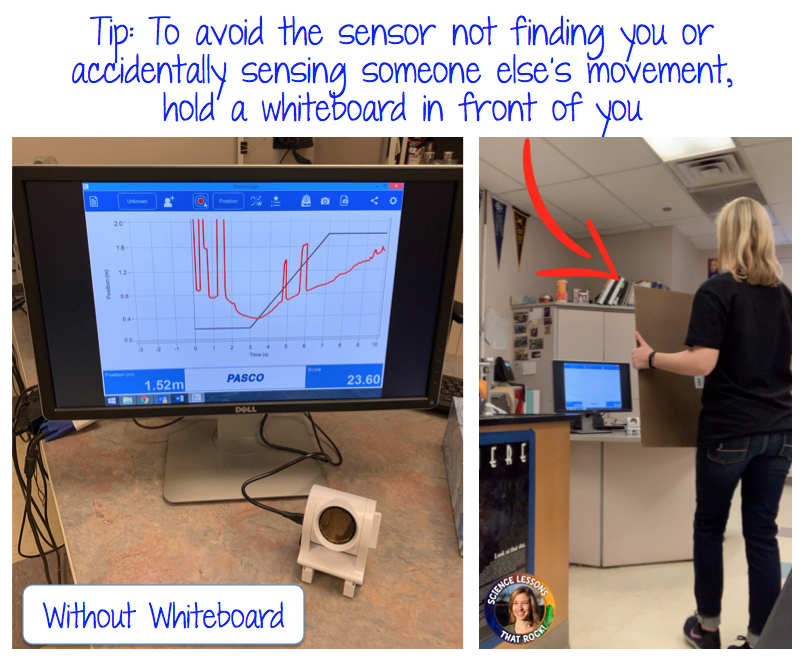
When you load Match Graph, you will see a main screen where you can switch between position-time graphs and velocity-time graphs. I always start with position-time graphs because they seem easier for the students to grasp. Next, have the students in each group type their name in the top so they can all take turns (more on this in a minute). When students are ready to begin, I have them hold a large whiteboard (any large flat surface works) in front of them- this seems to help the motion sensor detect them easily. The students will need about 4 meters of clearance behind them, so space your groups out around the room.
Each time they take a turn Match Graph shows a score in the bottom right corner of the screen. This is GREAT for easy grading. All you have to do is walk around the room, have them pull up the scores under their name, and you can record their highest score. It gets competitive!
Make sure to check out other resources PASCO has to offer on their website. In their digital library they have a TON of free labs you can download. Be sure to bookmark it for later!
(Note: This is a sponsored blog post from PASCO)


