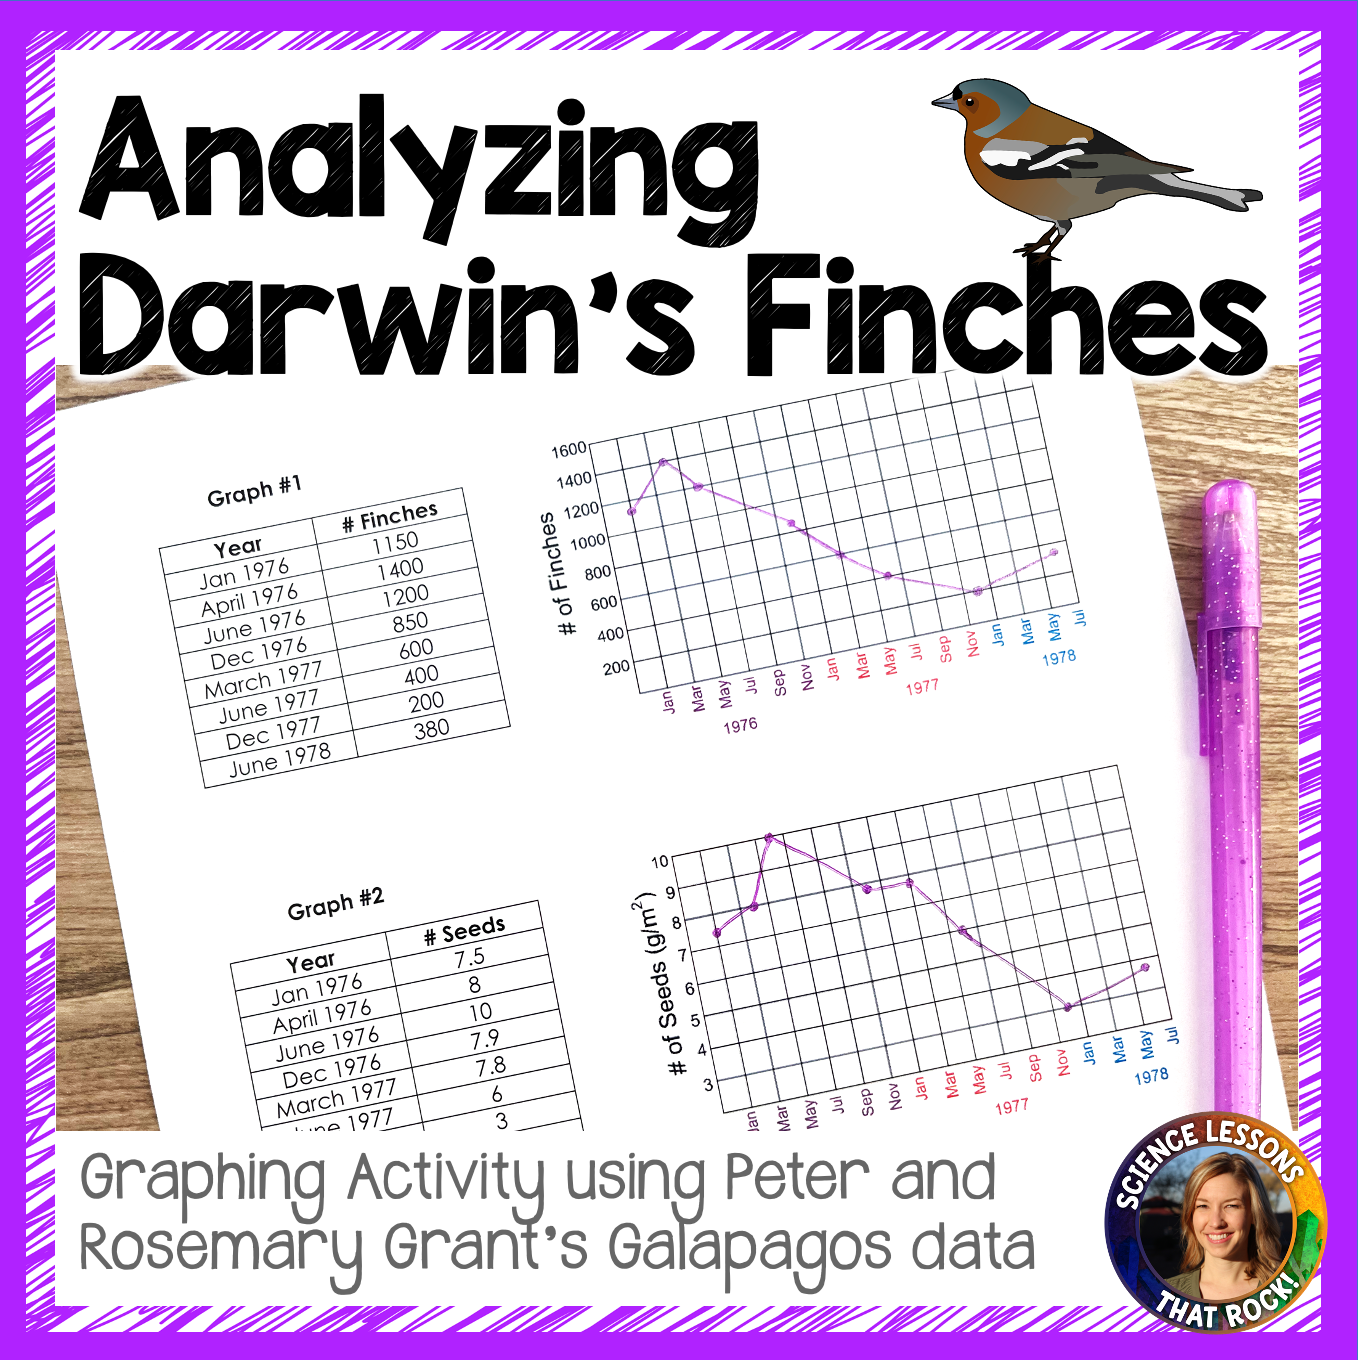
Analyzing Darwin's Finches- Evolution Graphing Activity
$3.50
In stock
Product Details
This is a great lesson to use when teaching natural selection and evolution! Peter and Rosemary Grant were 2 scientists that saw evolution happen first hand in finches on the Galapagos Islands. The Grant's were able to correlate beak size with seed size and got excellent data during wet and dry seasons. Students will complete three graphs for number of finches, number of seeds available, and type of seed (soft vs. hard). Graphs are already set up for the students, all they have to do is plot the data. Following the activity are analysis questions to ensure students make the connections between the research and Darwin's theory.
Analyzing Darwin's Finches- Evolution Graphing Activity
Display prices in:USD


